City Thematic Dashboard
Awareness of the city's needs starts with a correct understanding of what is happening. City dashboards are a powerful tool to have a wide view of a city’s life, and essential for management and governance, able to monitor key urban metrics and the performance of services and activities.
The aim is to create governance oriented towards the needs of citizens and focused on improving the work of the public administration, and most importantly, to have a digital infrastructure capable of integrating technologies already available in the municipality, making them more efficient and useful for all the stakeholders involved in the public sector.
Thematic Dashboard
With WiseTown you make data work for you. The City Thematic Dashboards of WiseTown guarantee an efficient collection and management of urban data integrated with open data. The map-based application provides customized views based on cartographic information, enriched with statistical and real-time data from satellite systems, IoT sensors, and other data sources. All dashboards offer the highest degree of configuration and allow effective analysis of urban phenomena. Easy access to data that continuously update is essential to improve city monitoring and get inside the complexity of reality to identify, predict and handle events and critical issues. Any thematic dashboard is focused on specific data and offers an in-deep representation of the related city context.
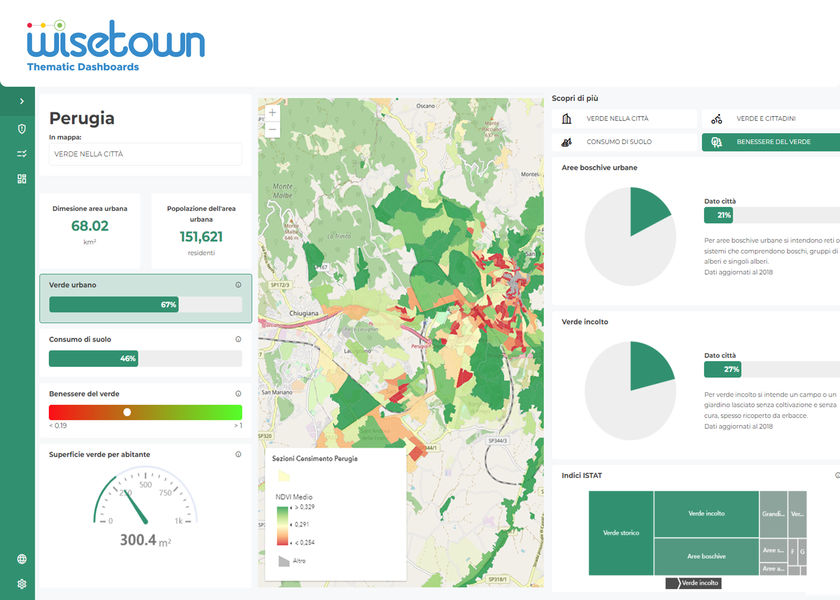
Green city Dashboard
This dashboard is precious to analyze, understand, and monitor urban green spaces. Quality indexes and strong data have driven scenarios to allow the analysis of public parks, gardens, and other green areas for reports on the health of plants and vegetation to make understand how urban green spaces can be improved and how this can impact citizens' health. This tool integrates satellite data and crosses them with census data to reveal the connections between the environment and the population.
Welfare Dashboard
Cities are made up of citizens and it is really important to keep into consideration data of this main component. A constant update of the distribution of families, children, young people, the elderly, and other indices on residents makes it possible to offer more suitable services and infrastructures to better respond to the needs of citizens.
Economics Dashboard
The equitable and sustainable well-being of citizens and companies is a priority to create a smart and livable city. The dashboard allows viewing the evolution of economic sustainability over time, highlighting any inequalities in the conditions of well-being related to the territory, level of education, gender, and generation.
Urban planning Dashboard
The application is crucial for a broad vision of our cities. Maps with indexes, parameters, and predictive analysis are a valuable support in the drafting of a new sustainable urban plan, tailored to the citizen and careful to urban environmental challenges. With a few clicks, you can have constant updates on population density, building / not building areas, roads, public areas (services, parking), etc. A powerful tool to simulate urban transition and transformation to achieve sustainable and resilient cities.
