Perugia
The municipality of Perugia is working on a very ambitious and innovative project relating to the implementation of City Thematic Dashboards to guarantee an efficient collection and management of city data integrated with open data. The aim is to create governance oriented towards the needs of citizens and focused on improving the work of the public administration, and most importantly, to have a digital infrastructure capable of integrating technologies already available in the municipality, making them more efficient and useful for all the stakeholders involved in the public sector.
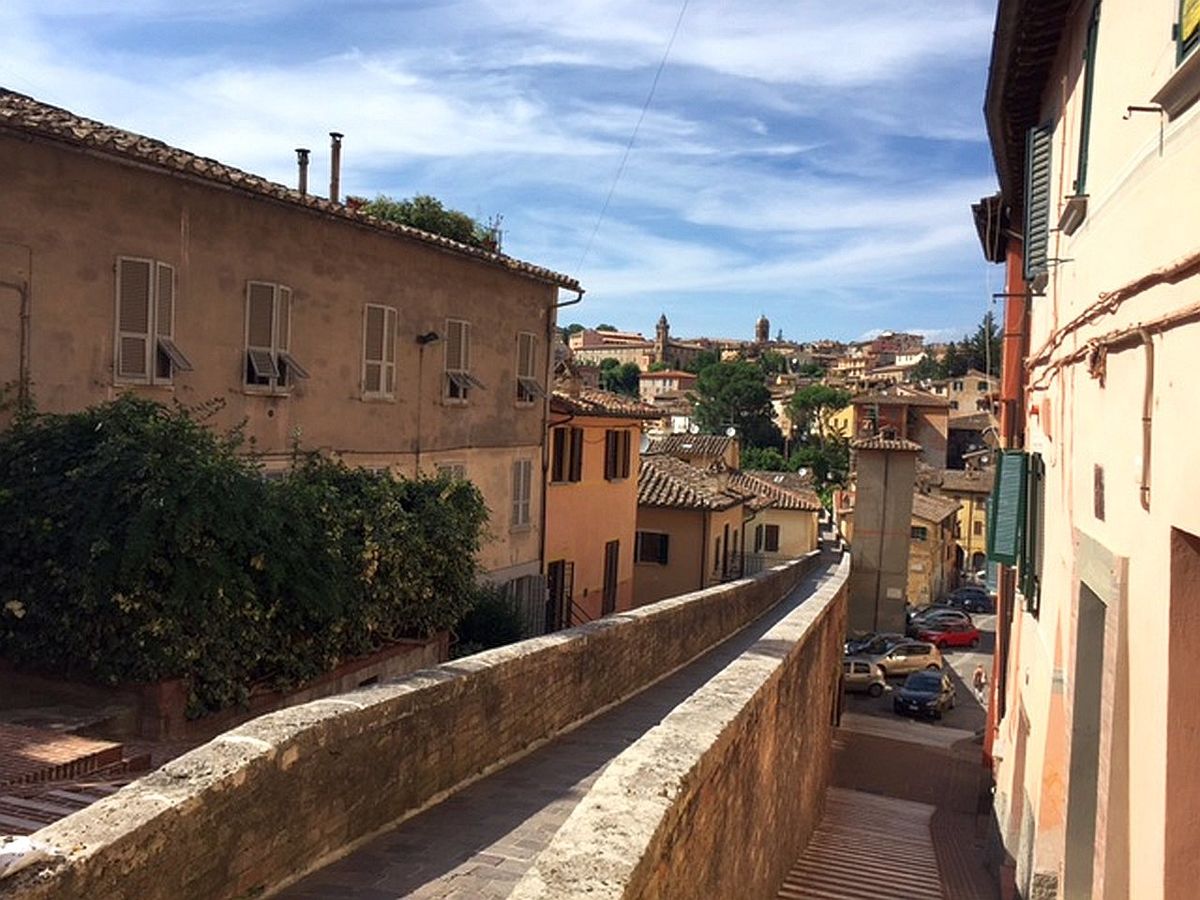
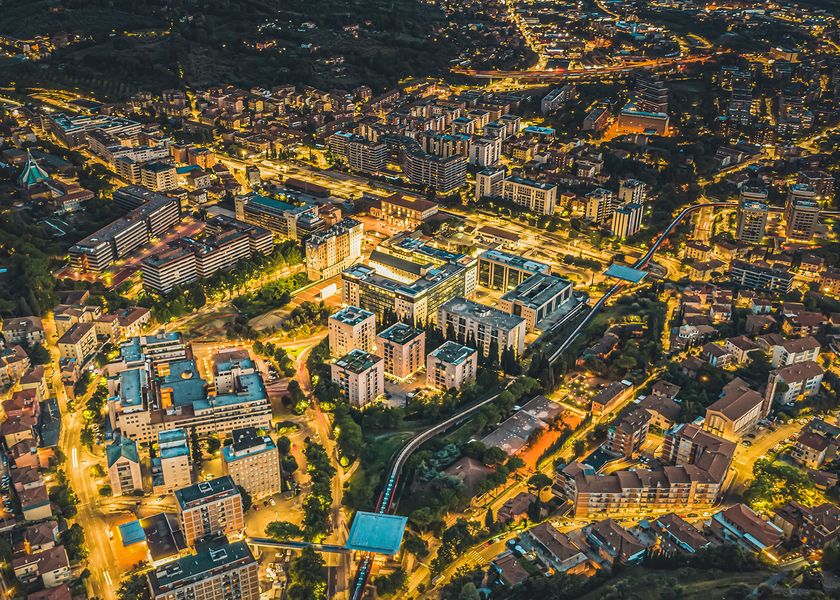
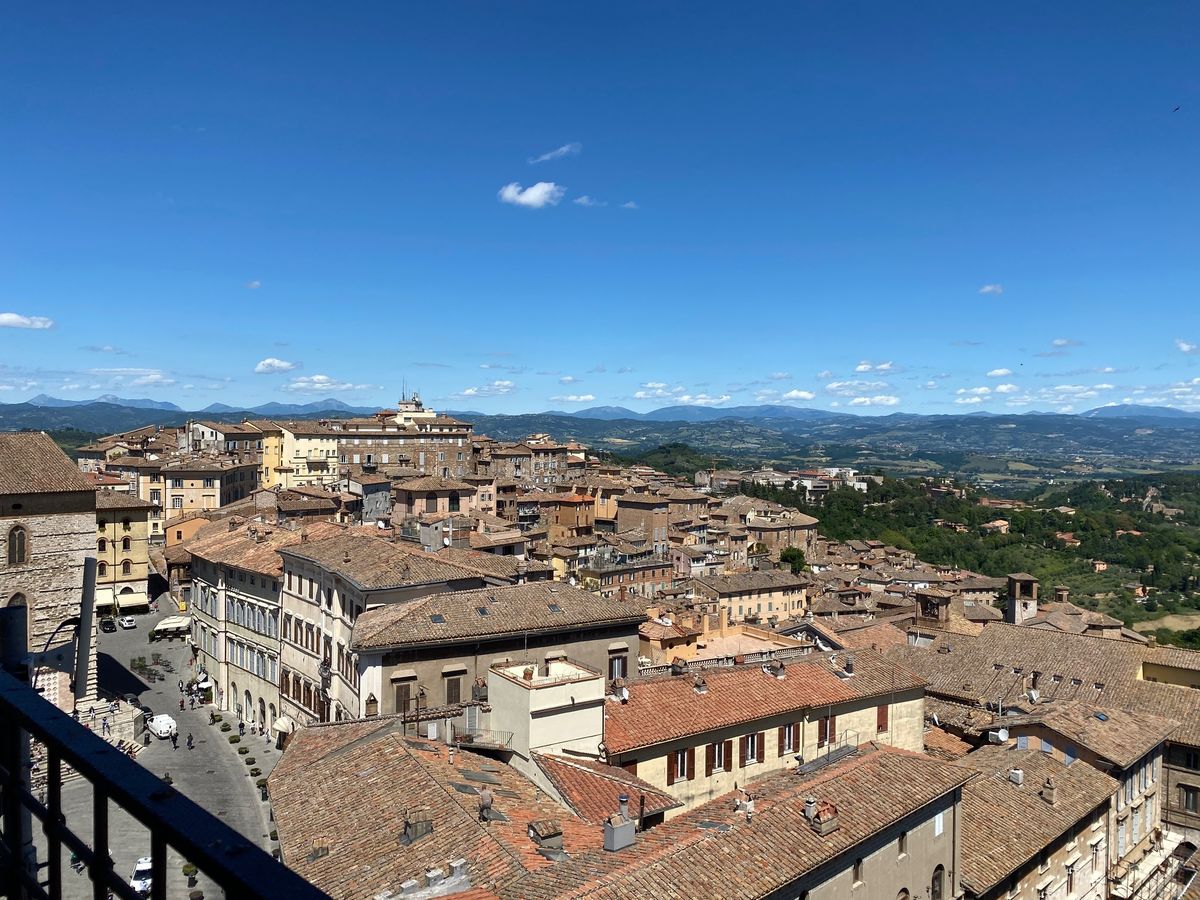
The city of Perugia (Italy) is the main urban center of the Umbrian region, not only in terms of administration but also based on its economy, social and cultural settings. Perugia has a population of around 165,000 inhabitants, a municipal area that extends for about 449 km² with a population density of 363.32 inhabitants / km². This means a vast territory requiring efficient and punctual services, supported by ongoing construction of communication channels between public administration and citizens.
Perugia’s digital transition to Smart City
The municipality of Perugia is working on a very ambitious and innovative project relating to the implementation of City Thematic Dashboards to guarantee an efficient collection and management of city data integrated with open data. The aim is to create governance oriented towards the needs of citizens and focused on improving the work of the public administration, and most importantly, to have a digital infrastructure capable of integrating technologies already available in the municipality, making them more efficient and useful for all the stakeholders involved in the public sector.
Making data work for the City
The City Thematic Dashboards, integrated into an application developed in collaboration with WiseTown powered by FIWARE, aim to transform Perugia into a digital city, efficient, safe, accessible, and able to develop a participatory and integrated approach to facilitate decision-making. This cutting-edge tech can elaborate and convert the vast quantity of unrelated data of the city into precious information, essential to have a complete view of the city's activities and life. This way the complexity of urban dynamics becomes easily interpretable information. Moreover, the European technological standards adopted in the construction of this solution, as well as the integration with FIWARE technologies, allow Perugia to comply with the European standards outlined by the CEF (Connecting Europe Facility), putting the city on the same level as other bigger European Smart Cities.
From city data to decision support
Awareness of the city's needs starts with a correct understanding of what is happening. Perugia’s Thematic Dashboards are interactive map-based applications that provide customized views based on cartographic information, enriched with statistical and real-time data from satellite systems, IoT sensors, and other data sources. All dashboards offer the highest degree of configuration and allow effective analysis of urban phenomena. Easy access to data that continuously update is essential to improve city monitoring and get inside the complexity of reality to identify, predict and handle events and critical issues. Any thematic dashboard is focused on specific data and offers an in-deep representation of the related city context.
Green city Dashboard
This dashboard is precious to analyze, understand, and monitor urban green spaces. Quality indexes and strong data have driven scenarios to allow the analysis of public parks, gardens, and other green areas for reports on the health of plants and vegetation to make understand how urban green spaces can be improved and how this can impact citizens' health. This tool integrates satellite data and crosses them with census data to reveal the connections between environment and population.
Welfare Dashboard
Cities are made up of citizens and it is really important to keep into consideration data of this main component. A constant update of the distribution of families, children, young people, the elderly, and other indices on residents makes it possible to offer more suitable services and infrastructures to better respond to the needs of citizens.
Economics Dashboard
The equitable and sustainable well-being of citizens and companies is a priority to create a smart and livable city. The dashboard allows viewing the evolution of economic sustainability over time, highlighting any inequalities in the conditions of well-being related to the territory, level of education, gender, and generation.
