Mapping and measuring accurately city photovoltaic and CO2 avoidance

No city possess a detailed map of all installed photovoltaic capacity (mainly roof-tops), i.e almost the only renewable source of energy that can be used within a urban context and therefore cannot measure how much renewable energy is produced and consumed and how much CO2 this production avoids, that is the starting point for any effective and measurable climate action plan for carbon neutrality.
Our software can find from the satellite 100% of the existing PV plants and measure accurately historic, real-time production of all the plants providing an accurate forecast of the same. Based on such detailed measures we have developed new 'climate sensitive scientific indexes' such as: avoided CO2 and CH4, adult trees equivalent work, forest size equivalent measures amongst others.
Having a detailed map of all existent PV plants helps to calculate how much res energy are already offsetting GHG emissions and to set-up a strategy for the future increased deployment of PV in the city provided a 400% increase of photovoltaic within 2030 is already forecasted. the same map will help recharging station positioning to be supplied by renewable energy and energy communities within positive energy district to be scaled up in the entire city with consequent energy and money saving for the citizen.
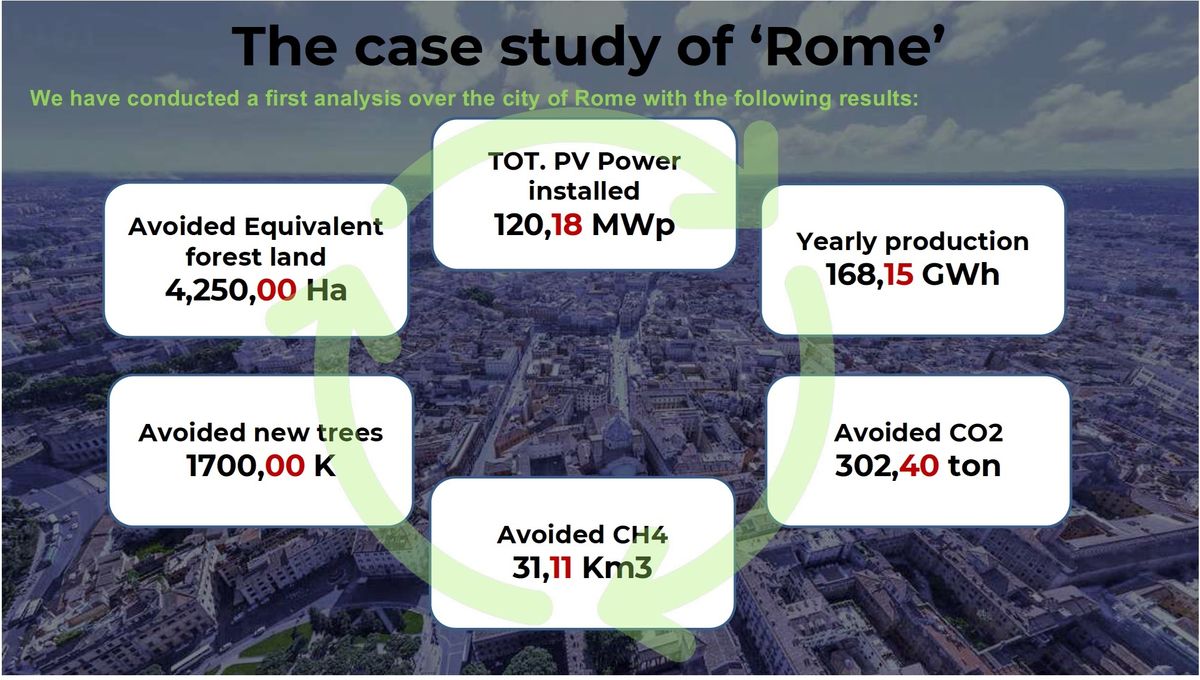
We have conducted a study over the city of Rome and found 120 Map already installed a yearly production of 168,15 GWh, 302,40 ton of avoided CO2, 31,11 Km3 Avoided CH4, 1,700,000 avoided adult trees work equivalent to a forest occupying 4,250 Ha of land.